Categories
Coding R Statistics

Quasi-Random Number Generation in R

Random number generation is a core topic in numerical computer science. There are many efficient
algorithms for generating random (strictly speaking, pseudo-random) variates
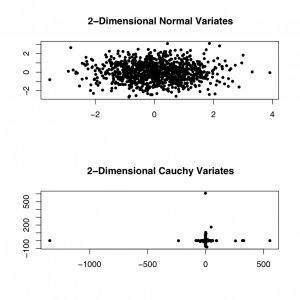
from different probability distributions. The figure below shows a
sampling of 1000 two-dimensional random variates from the standard Gaussian and
Cauchy distributions, respectively. The size of the extreme deviations of the
Cauchy distribution is apparent from the graph.

Gaussian and Cauchy Random Variates

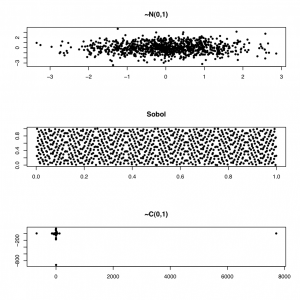
However, sometimes we need to produce numbers that are more evenly distributed (quasi-random numbers). For example, in a Monte Carlo integration exercise, we can get faster convergence with a lower error bound using so-called low-discrepancy random sequences, using the GSL library. In the figure below, we show two-dimensional normal and Sobol (a low-discrepancy generator) variates.
Quasi-Random Numbers
Normal, Cauchy, and Sobol 2-d variates

To generate the graph below, I used the GSL library for R, as shown below:

[source lang=”R”]
library(gsl)
q <- qrng_alloc(type="sobol", 2)
rs <- qrng_get(q,1000)
par(mfrow=c(3,1))
plot(rnorm(1000), rnorm(1000), pch=20, main="~N(0,1)",
ylab="", xlab="")
plot(rs, pch=20, main="Sobol",
ylab="", xlab="")
plot(rcauchy(1000), rcauchy(1000),pch=20,
main="~C(0,1)", ylab="",xlab="")
[/source]

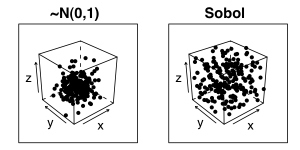
The property of low-discrepancy generators is even more apparent if we view the random variates in a higher dimension, for example the figure below shows the variates as a 3-dimensional cube. Note how the clustering around the centre of the cube is much more pronounced for the Gaussian cube.
3D Random Variates
3D Random Variates

To plot the figure above, I used the GSL and Lattice libraries:

[source lang=”R”]
library(gsl)
library(lattice)
q <- qrng_alloc(type="sobol", 3)
npoints <- 200
rs <- qrng_get(q,npoints)
ltheme <- canonical.theme(color = FALSE)
ltheme$strip.background$col <- "transparent"
lattice.options(default.theme = ltheme)
trellis.par.set(layout.heights =
list(top.padding = -20,
main.key.padding = 1,
key.axis.padding = 0,
axis.xlab.padding = 0,
xlab.key.padding = 0,
key.sub.padding = 0,
bottom.padding = -20))

# Plot the normal variates in a 3-dim cube
p1 <- cloud(rnorm(npoints) ~ rnorm(npoints) + rnorm(npoints), xlab="x", ylab="y",
zlab="z", pch=20, main="~N(0,1)")
p2 <- cloud(rs[,1] ~ rs[,2] + rs[,3], xlab="x", ylab="y",
zlab="z", pch=20, main="Sobol")
print(p1, split=c(1,1,2,1), more=TRUE)
print(p2, split=c(2,1,2,1))
[/source]
Categories
Coding R

The Euler Method In R

The Euler Method is a very simple method used for numerical solution of initial-value problems. Although there are much better methods in practise, it is a nice intuitive mechanism.

The objective is to find a solution to the equation

$$ \frac{dy}{dt} = f(t,y) $$

over a grid of points (equally spaced, in our case). Euler’s method uses the relation (basically a truncated form of Taylor’s approximation theorem with the error terms chopped off):

$$ y(t_{i+1}) = y(t_i) + h\frac{df(t_i, y(t_i))}{dt}$$

In R, we can express this iterative solution as:

[source lang=”R”]
euler <- function(dy.dx=function(x,y){}, h=1E-7, y0=1, start=0, end=1) {
nsteps <- (end-start)/h
ys <- numeric(nsteps+1)
ys[1] <- y0
for (i in 1:nsteps) {
x <- start + (i-1)*h
ys[i+1] <- ys[i] + h*dy.dx(x,ys[i])
}
ys
}
[/source]

Note that given the start and end points, and the size of each step, we figure out the number of steps. Inside the loop, we calculate each successive approximation.

An example using the difference equation

$$ \frac{df(x,y)}{dx} = 3x – y + 8$$

is:

[source lang=”R”]
dy.dx <- function(x,y) { 3*x – y + 8 }
euler(dy.dx, start=0, end=0.5, h=0.1, y0=3)
[1] 3.00000 3.50000 3.98000 4.44200 4.88780 5.31902
[/source]

Categories
Coding R

Newton’s Method In R

Here is a toy example of implementing Newton’s method in R. I found some old code that I had written a few years ago when illustrating the difference between convergence properties of various root-finding algorithms, and this example shows a couple of nice features of R.

Newtons method is an iterative root-finding algorithm where we start with an initial guess \(x_0\) and each successive guess is refined using the iterative process:

$$ x_{n+1} = x_n – \frac{f(x_n)}{f'(x_n)} $$

Here is a simple implementation of this in R:

[source lang=”R”]
newton <- function(f, tol=1E-12,x0=1,N=20) {
h <- 0.001
i <- 1; x1 <- x0
p <- numeric(N)
while (i<=N) {
df.dx <- (f(x0+h)-f(x0))/h
x1 <- (x0 – (f(x0)/df.dx))
p[i] <- x1
i <- i + 1
if (abs(x1-x0) < tol) break
x0 <- x1
}
return(p[1:(i-1)])
}
[/source]

Note a couple of things:

* The step-size for numerical differentiation is hardcoded to be 0.001. This is arbitrary and should probably be a parameter.
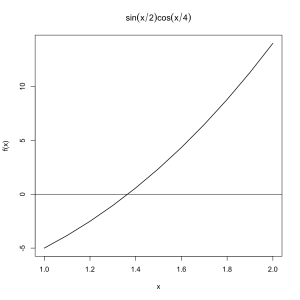
* The algorithm will run until either the number of steps N has been reached, or the error tolerance \(\left|x_{n+1}-x_n\right|< \epsilon\), where \(\epsilon\) is defined as the tolerance parameter tol. * The function returns a vector of the iterated x positions, which will be <= N. Here is a simple example: for instance, to find the zeros of the function $$ f(x) = x^3 + 4x^2 - 10 $$ which in R we can represent as: [source lang="R"]f <- function(x) { x^3 + 4*x^2 -10 }[/source] Let's plot the function over the range [1,2]:

[source lang=”R”]
plot(x,f(x), type=’l’, lwd=1.5, main=expression(sin(x/2) * cos(x/4)))
abline(h=0)
[/source]

It seems obvious from the plot that the zero of f(x) in the range [1,2] is somewhere between x=1.3 and x=1.4.

This is made even more clear if we tabulate the x,y values over this range:

[source lang=”R”]
> xy <- cbind(x,f(x))
> xy
x
[1,] 1.0 -5.000
[2,] 1.1 -3.829
[3,] 1.2 -2.512
[4,] 1.3 -1.043
[5,] 1.4 0.584
[6,] 1.5 2.375
[7,] 1.6 4.336
[8,] 1.7 6.473
[9,] 1.8 8.792
[10,] 1.9 11.299
[11,] 2.0 14.000
[/source]

Using the function defined earlier, we can run the root-finding algorithm:

[source lang=”R”]
> p <- newton(f, x0=1, N=10)
> p
[1] 1.454256 1.368917 1.365238 1.365230 1.365230 1.365230 1.365230
[/source]

This returns 1.365230 as the root of f(x). Plotting the last value in the iteration:

[source lang=”R”]
> abline(v=p[length(p)])
[/source]

In the iteration loop, we use a schoolbook-style numerical derivative:

$$ \frac{dy}{dx} = \frac{f(x+\epsilon)-f(x)}{\epsilon} $$

Its also worth noting that R has some support for symbolic derivatives, so we could use a symbolic function expression. A simple example of symbolic differentiation in R (note that R works with expression instances when using symbolic differentiation):

[source lang=”R”]
> e <- expression(sin(x/2)*cos(x/4))
> dydx <- D(e, "x")
> dydx
cos(x/2) * (1/2) * cos(x/4) – sin(x/2) * (sin(x/4) * (1/4))
[/source]

In order for this to be useful, obviously we need to be able to evaluate the calculated derivative. We can do this using eval:

[source lang=”R”]
> z <- seq(-1,1,.1)
> eval(dydx, list(x=z))
[1] 0.3954974 0.4146144 0.4320092 0.4475873 0.4612640 0.4729651 0.4826267
[8] 0.4901964 0.4956329 0.4989067 0.5000000 0.4989067 0.4956329 0.4901964
[15] 0.4826267 0.4729651 0.4612640 0.4475873 0.4320092 0.4146144 0.3954974
[/source]

Note that we can bind the x parameter in the expression when calling eval().