Categories
Coding

Debugging DLL Loading Issues in Windows

Attempting to debug dynlib loading issues in Windows can be tricky – on Linux you can use strace to monitor dynamic linking and see what libraries are being loaded as the application runs. Having just had some issues with dynlib loading issues in an R extension I wrote, I was keen to find a good way to debugging the issues as they occurred. Thankfully, there are some good utilities out there for debugging this kind of thing:

Dependency Walker is an old SDK tool that is still invaluable. Drag a .DLL or .EXE into the application window and it will show you the dependencies, what type of loading mechanism they use (e.g. eager or delay load), and also what exported functions from the dependent DLLs are actually used by the .DLL or .EXE you have selected.

Here is a screenshot of depends.exe operating on my R extension DLL. Note that MSCVR80.DLL and R.DLL are both highlighted as missing – this is extremely useful for figuring out dependent DLL load issues.
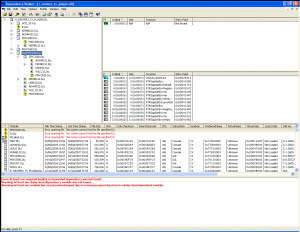
Dependency Walker
Dependency Walker

The SysInternals Process Monitor is an incredibly useful low-level Swiss Army Knife utility that can be used, among other things, to monitor dynamic library loading activity as it occurs, using the file activity view. Here is a view of Process Monitor monitoring R as it loads my extension DLL. The subsequent dependent DLL loading activity is highlighted.
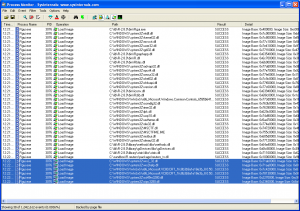
Process Explorer
Process Explorer
Categories
Coding Finance R

R/Reuters Real-Time Data Extension

Last week, I posted an R extension DLL that downloads historical data from Reuters using the SFC API. This time around, I am posting an extension DLL that can subscribe to real-time updates using the RFA API. This extension allows you to specify a list of items and data fields, and subscribe for a specified amount of time to updates on those items.

Here is an example:

# Load the DLL
dyn.load("RfaClient")

# Low-level subscription function wrapper
rsub < - function(time, items, func, sessionName, config, debug) { .Call("subscribe", as.integer(time), items, func , sessionName, config, debug) } # Define items and fields to subscribe to items <- list() fields <- c("BID","ASK","TIMCOR") items[[1]] <- c("IDN_SELECTFEED", "GBP=", fields) items[[2]] <- c("IDN_SELECTFEED", "JPY=", fields) # Callback function (invoked when data items update) callback <- function(df) { print(paste("Received an update for",df$ITEM, ", update time=", df$TIMCOR)) } # Subscribe for 5 seconds using the supplied config parameters rsub(5000, items, callback, "clientSession", "rfa.cfg", FALSE)

A short introductory guide is supplied:

Introduction (PDF)
Introduction (PDF)

The functionality is pretty basic right now, and there may be issues with the code (e.g. memory leaks, performance issues). Any feedback is gratefully received.

The package, including source, can be downloaded here:

rfaclient.zip

It was built with R 2.8.0 and RFA C++ 6.0.2, using Visual C++ 2005.

Categories
Coding R

Working With Unicode Symbols in R and Vim

I came across a Vim feature today that I had forgotten about for a while – digraphs. Digraphs are basically Vim abbreviations for encoded character shortcuts. Typing <ctrl-K> followed by the digraph will insert the mapped character into the file. For instance, to insert the Euro symbol, type

<CTRL-K>Eu.

A list of existing digraphs can be shown using :digraph, and a new digraph can be added using the same command.

For instance, to add new digraphs for the Unicode male (♂) and female (♀) gender symbols, which are Unicode code points 9794/0x2642 and 9792/0x2640 respectively, you can type:

:dig Ma 9794
:dig Fe 9792

Similarly, R can insert Unicode code points into text and labels, and even data point symbols. One little-known convention in R is that if a data point symbol is negative, it is taken to be a Unicode code point. The following example generates some random data, and then displays the data with either a male or female symbols depending on whether the data point is divisible by 2 or not. Also, the symbols are inserted into the plot title using the \u character prefix.

> gender < - rbinom(n=100, size=100, prob=0.5) > plot(gender, cex=2.5,
pch=ifelse(gender %% 2 == 0, -0x2642L, -0x2640L),
col=ifelse(gender %% 2 == 0, 2, 3), main="\u2640 and \u2642 Trials")

Plot Example
Plot Example