[UPDATE: After reading this post, see here for an updated version of the spreadsheet].
The Black-Scholes option valuation formula for an option paying a continuous dividend yield is the following:

Where
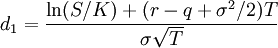
and
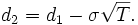
Attached is a simple Excel function that calculates the Black-Scholes option value for a specific set of input parameters. Currently, it just calculates the call value – if you use it as an array function, it will return a 4-element array with call value, call delta, put value, put delta, respectively. You could extend it pretty easily to calculate the rest of the Greeks.
Here is the code for the function (To create an Excel function, press ALT-F11 in your workbook and select Insert>Module. Note that the dividend yield parameter is optional.
Function BlackScholes(SpotPrice As Double, ExercisePrice As Double,
        TimeToMaturity As Double, RiskFreeRate As Double, sigma As Double,
        Optional DividendYield As Double) As Double()

    Dim d1 As Double
    Dim d2 As Double
    Dim Nd1 As Double
    Dim Nd2 As Double
    Dim ResultArray() As Double

    ReDim ResultArray(4) As Double

    If (IsMissing(DividendYield)) Then
        d1 = WorksheetFunction.Ln(SpotPrice / ExercisePrice) +
                ((RiskFreeRate + (0.5 * (sigma ^ 2))) * TimeToMaturity)
    Else
        d1 = WorksheetFunction.Ln(SpotPrice / ExercisePrice) +
                ((RiskFreeRate - DividendYield + (0.5 * (sigma ^ 2))) * TimeToMaturity)
    End If

    d1 = d1 / (sigma * (TimeToMaturity ^ (1 / 2)))
    d2 = d1 - (sigma * (TimeToMaturity ^ (1 / 2)))
    Nd1 = WorksheetFunction.NormSDist(d1)
    Nd2 = WorksheetFunction.NormSDist(d2)

    'Call Value
    If (IsMissing(DividendYield)) Then
        ResultArray(0) = (SpotPrice * Nd1)
                - (ExercisePrice * Exp(-RiskFreeRate * TimeToMaturity) * Nd2)
    Else
        ResultArray(0) = Exp(-DividendYield * TimeToMaturity) * (SpotPrice * Nd1)
                - (ExercisePrice * Exp(-RiskFreeRate * TimeToMaturity) * Nd2)
    End If

    'Call Delta
    ResultArray(1) = Nd1

    'Put Value
    If (IsMissing(DividendYield)) Then
        ResultArray(2) = Exp(-RiskFreeRate * TimeToMaturity)
                * ExercisePrice * (1 - Nd2) - SpotPrice * (1 - Nd1)
    Else
        ResultArray(2) = Exp(-RiskFreeRate * TimeToMaturity) * ExercisePrice
                * WorksheetFunction.NormSDist(-d2) - Exp(-DividendYield * TimeToMaturity)
                        * SpotPrice * WorksheetFunction.NormSDist(-d1)
    End If

    'Put delta
    ResultArray(3) = -WorksheetFunction.NormSDist(-d1)

    BlackScholes = ResultArray
End Function
Save this, and set up the input parameters in Excel. Select a range of 4 cells, and then click the f(x) function selection button. Choose from the list of User Defined functions, and then select BlackScholes. Excel will prompt you for the input parameters:
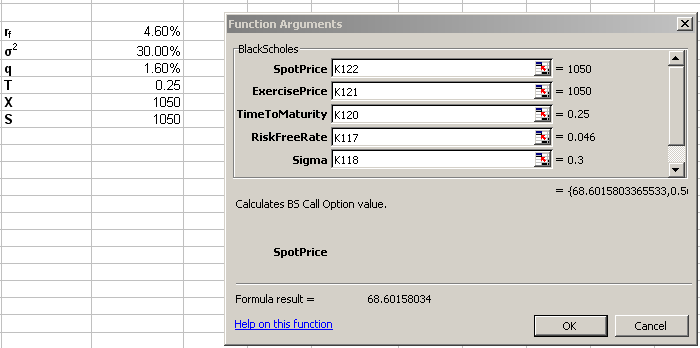
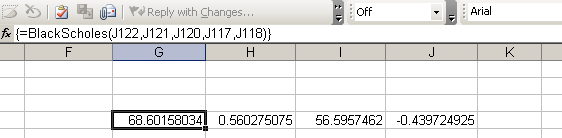
When you are finished inputing the parameters, press CTRL+SHIFT+ENTER to execute the function. Excel will populate the four cells with the calculated option values:
A sample workbook is attached:BlackScholes.xls